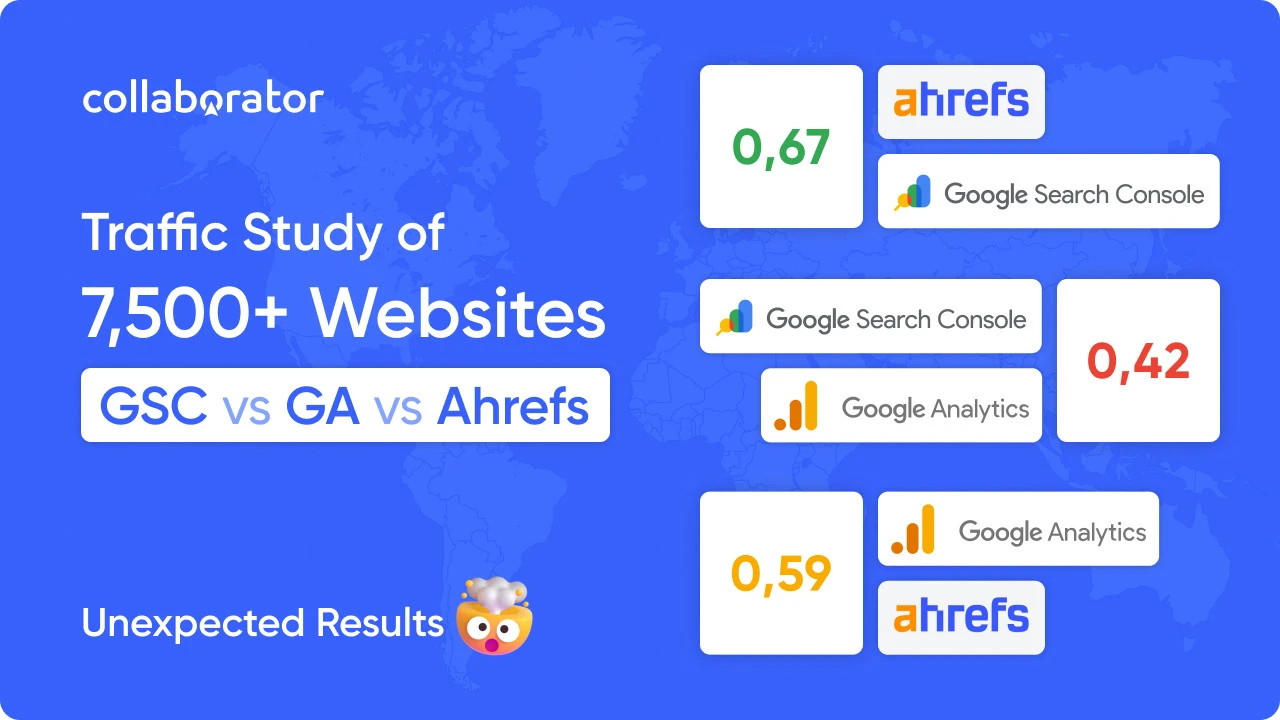
Traffic Analysis of 7,500+ Websites: Ahrefs vs Google Analytics vs Google Search Console. Unexpected Results

|
Imagine a typical situation: you’re looking for a website to place your article. How do you choose a donor when Ahrefs, Google Analytics, and Google Search Console show completely different numbers? And how do you avoid wasting your budget on a site that looks better than it actually is? |
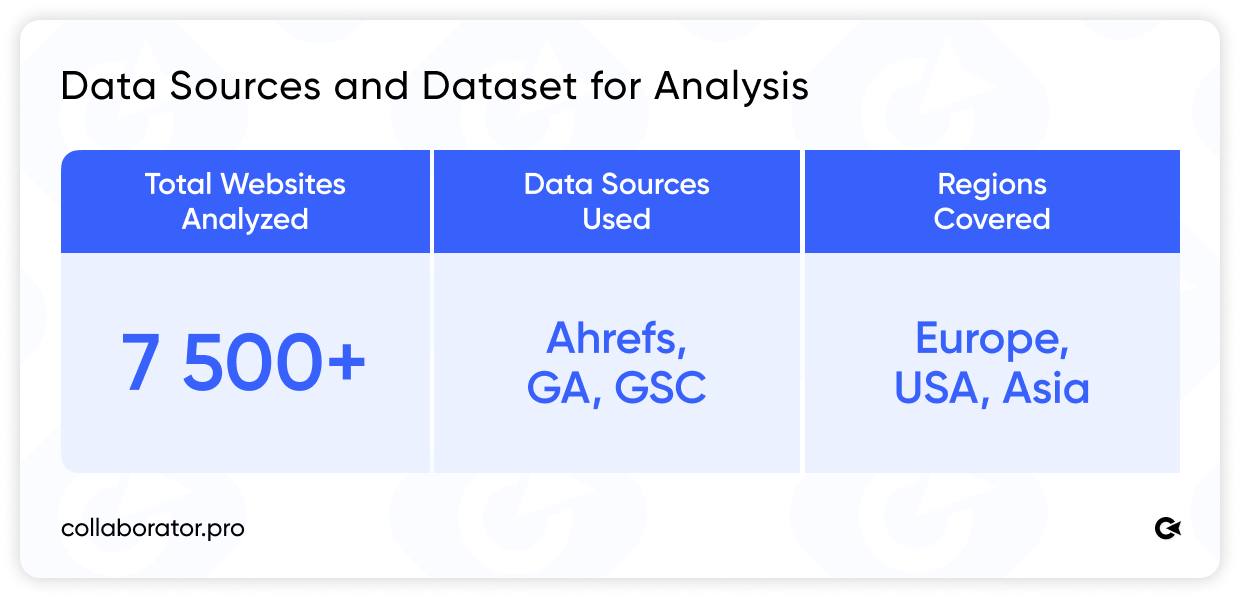
The Collaborator team, together with Serhii Koksharov, conducted a correlation analysis of traffic data from 7,500+ websites using real metrics from Ahrefs, Google Analytics, and Google Search Console.
In this article, you’ll find the results, unexpected insights, and practical takeaways for those who choose sites for link placement every day: SEO specialists, link builders, and digital marketers.
Key Takeaways
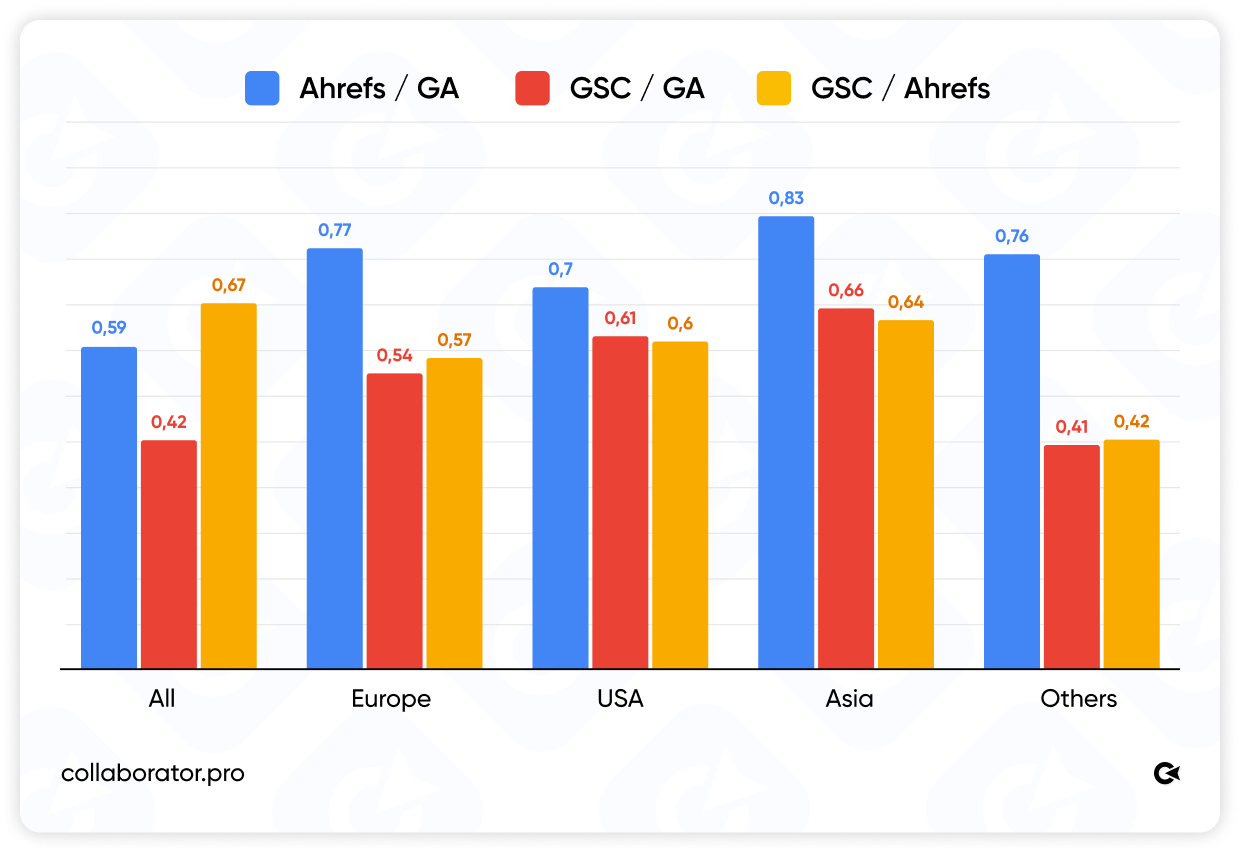
- Ahrefs and GSC show the highest correlation at 0.67
- GA and GSC data correlate significantly less at 0.42
- Ahrefs reflects a website’s SEO visibility relatively well, especially when combined with GSC
- Correlation varies by region, so GEO should be considered when evaluating websites
- As traffic grows, discrepancies increase, making multi-source analysis even more important
- The most reliable approach when evaluating donor websites is to compare multiple traffic sources rather than rely on a single one
Research Methodology
Since all three tools measure traffic differently, their absolute values cannot be compared directly. That’s why the data were normalized before analysis to place them on a common scale and evaluate trends rather than specific numbers.
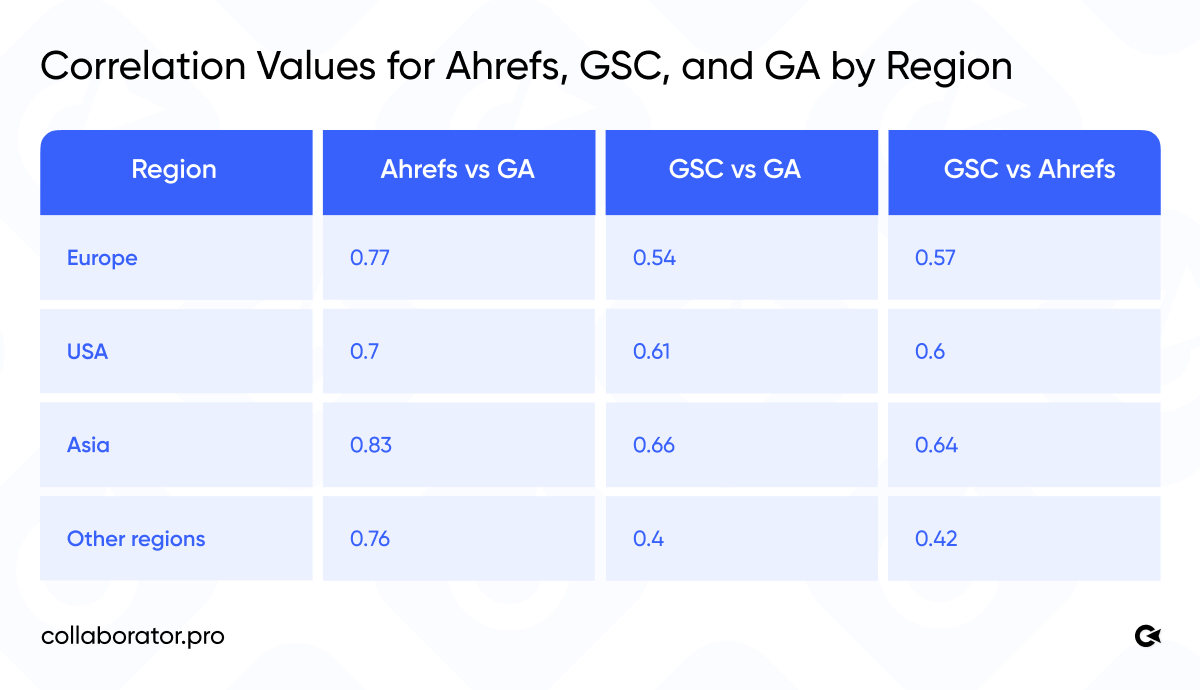
Next, correlation was calculated for each pair of data sources: Ahrefs vs GA, Ahrefs vs GSC, and GA vs GSC. The analysis was also conducted separately across different geographic segments: Europe, the USA, Asia, and other regions.
A quick reference for interpreting correlation values in practice:
- 0.0–0.3 — weak correlation;
- 0.3–0.6 — moderate correlation;
- 0.6+ — strong correlation.
Results: Overall Correlation Between Ahrefs, GA, and GSC
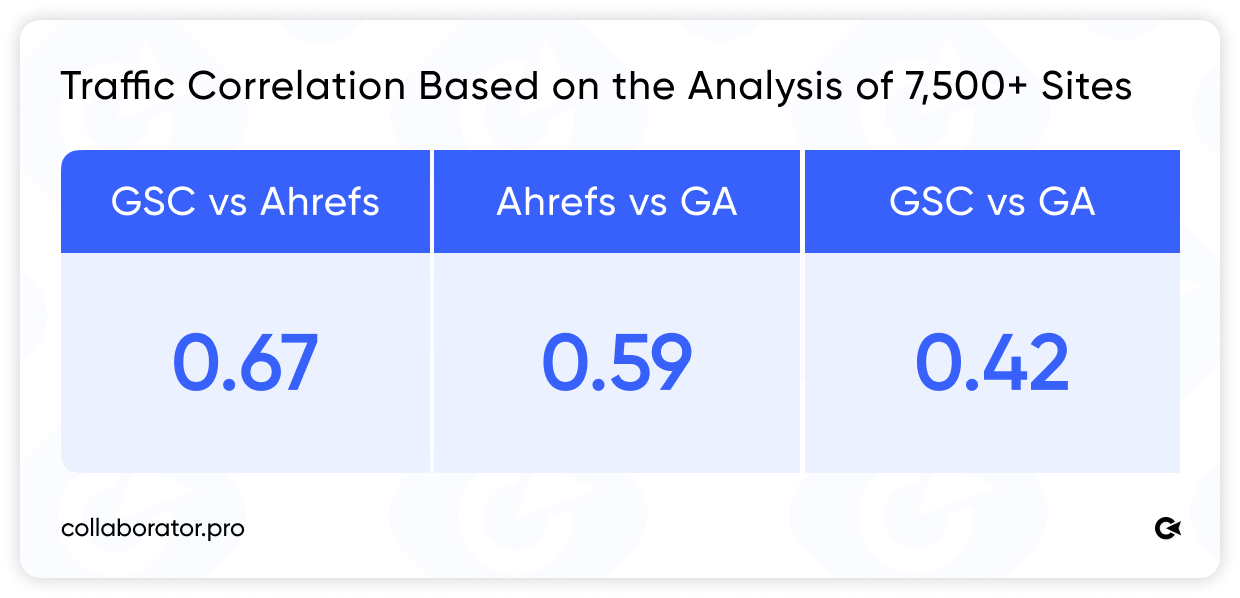
Ahrefs and GSC data show the highest correlation at 0.67. It is a moderately strong relationship, meaning that if Ahrefs estimates a website as having high traffic, GSC will most likely confirm it, and vice versa.
Both Ahrefs and GSC measure a website’s SEO visibility in search, including rankings, keywords, and organic clicks. They look at the same thing, just from different angles.
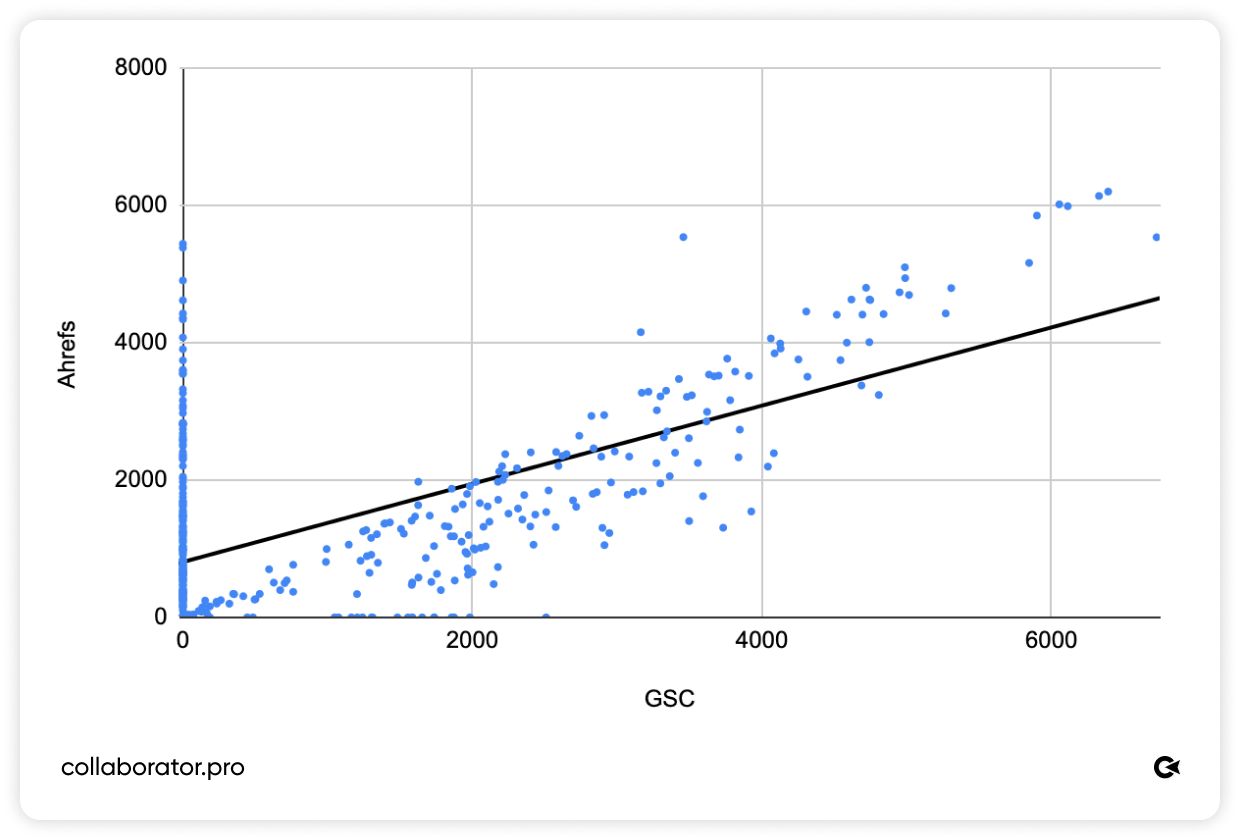
The distribution of traffic values from Ahrefs and GSC across different GEOs.
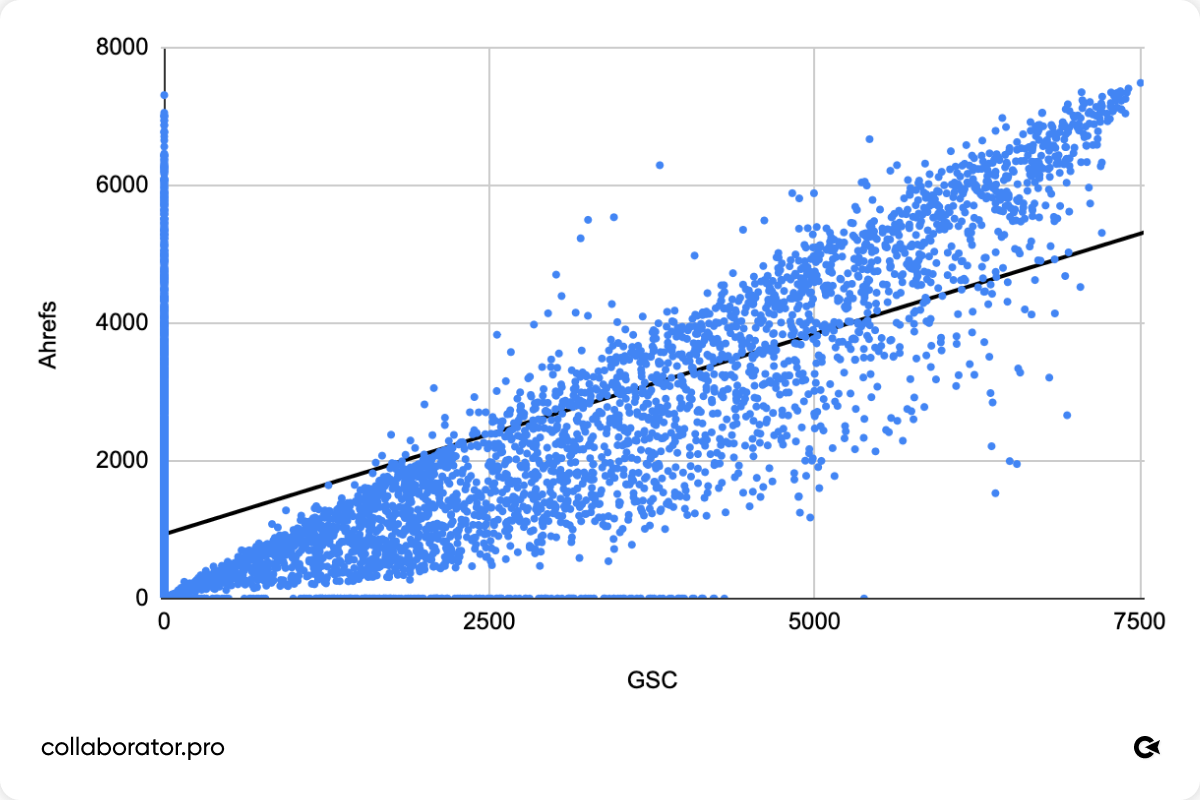
Ahrefs and GA rank second with a correlation of 0.59. GA tracks actual user behavior after the click, which is a fundamentally different type of data, so its correlation with the other tools is lower.
The distribution of traffic values from Ahrefs and GA across different GEOs.
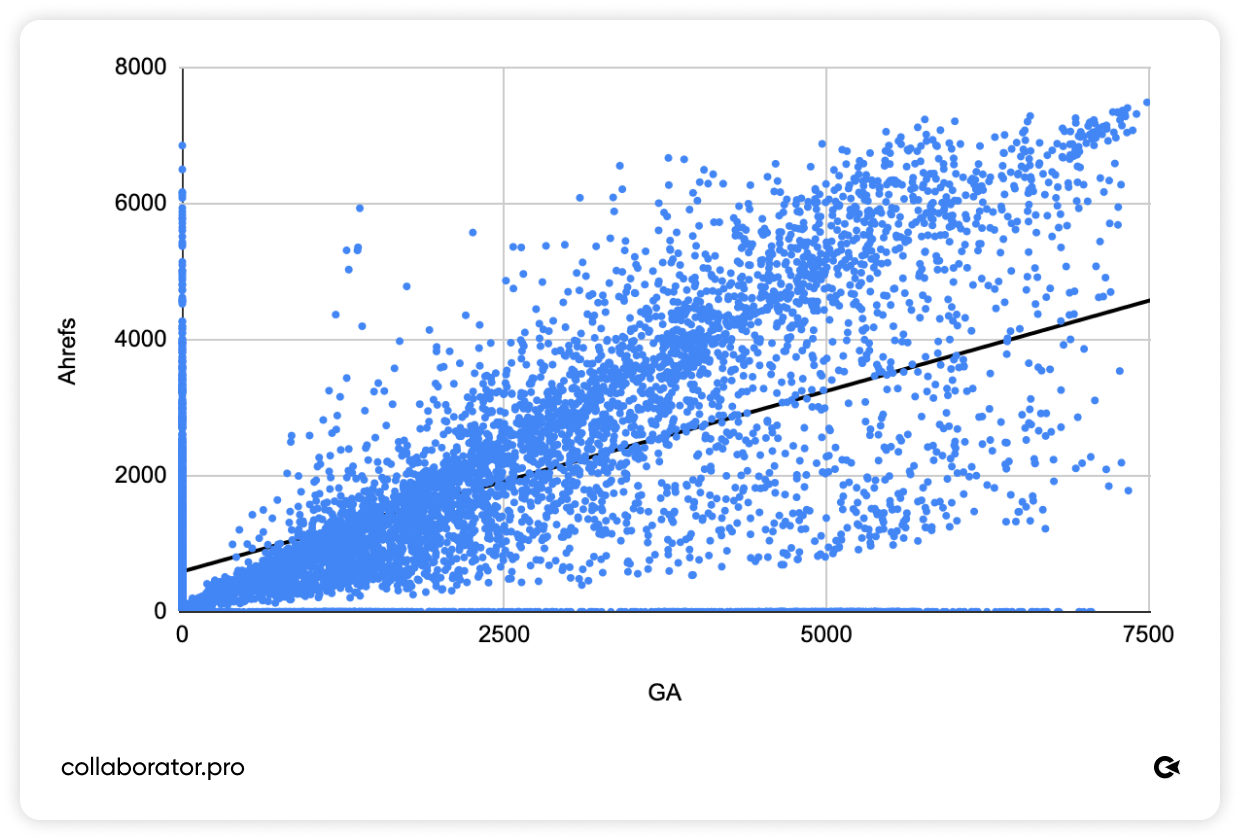
Unexpected result: two Google products, Analytics and Search Console, show the lowest correlation among all three pairs (0.42).
The distribution of traffic values from GSC and GA across different GEOs.
Why does this happen? Let’s take a closer look.
Why GA and GSC Show the Lowest Correlation
At first glance, both Google services should report similar data for the same website. However, the correlation between them is the lowest.
Several hypotheses may explain this gap:
- Some Google traffic may be attributed to direct traffic, even though it still appears in Search Console. For example, this can happen with featured snippets or AI Overviews.
- Referrer data may be lost in some cases.
- GA and GSC handle bot filtering differently.
Important note: these are only hypotheses. The exact reason for the discrepancies depends on the specific website, its technical setup, and its audience.
Google Analytics is not a “gold standard” for SEO analysis, especially when evaluating a donor’s organic traffic.
How Correlation Varies by Region
- Asia shows the strongest alignment between Ahrefs and GA. That may indicate that Asian websites have fewer discrepancies between estimated SEO visibility and actual traffic, or that their traffic structure is more predictable in terms of attribution.
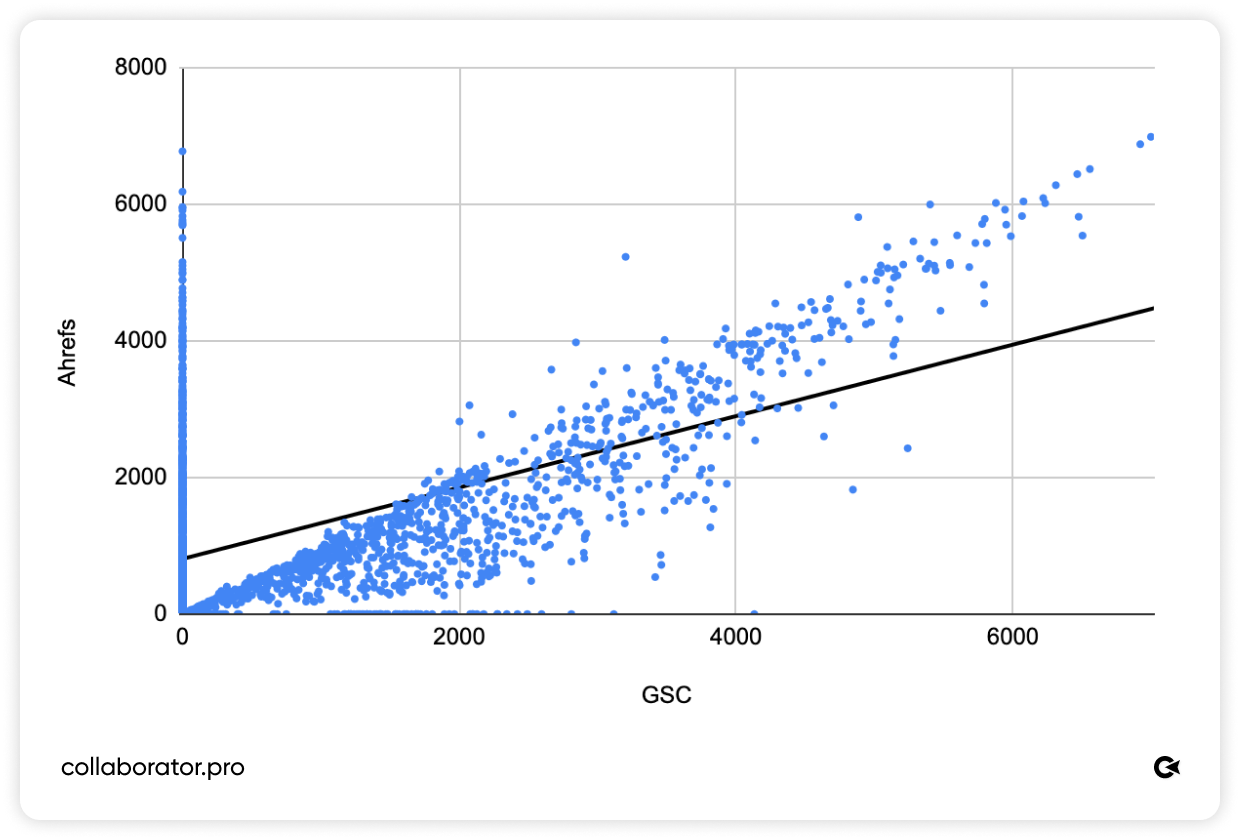
The distribution of traffic values from Ahrefs and GSC for Asian websites.
For Asian websites, Ahrefs and GA data align better than in other regions. Both metrics can be used as complementary indicators.
- For Europe and the USA, the correlation remains moderate. It means that when evaluating donor websites in these regions, relying on a single metric is even riskier, as different tools may yield significantly different results.
The distribution of traffic values from Ahrefs and GSC for European websites.
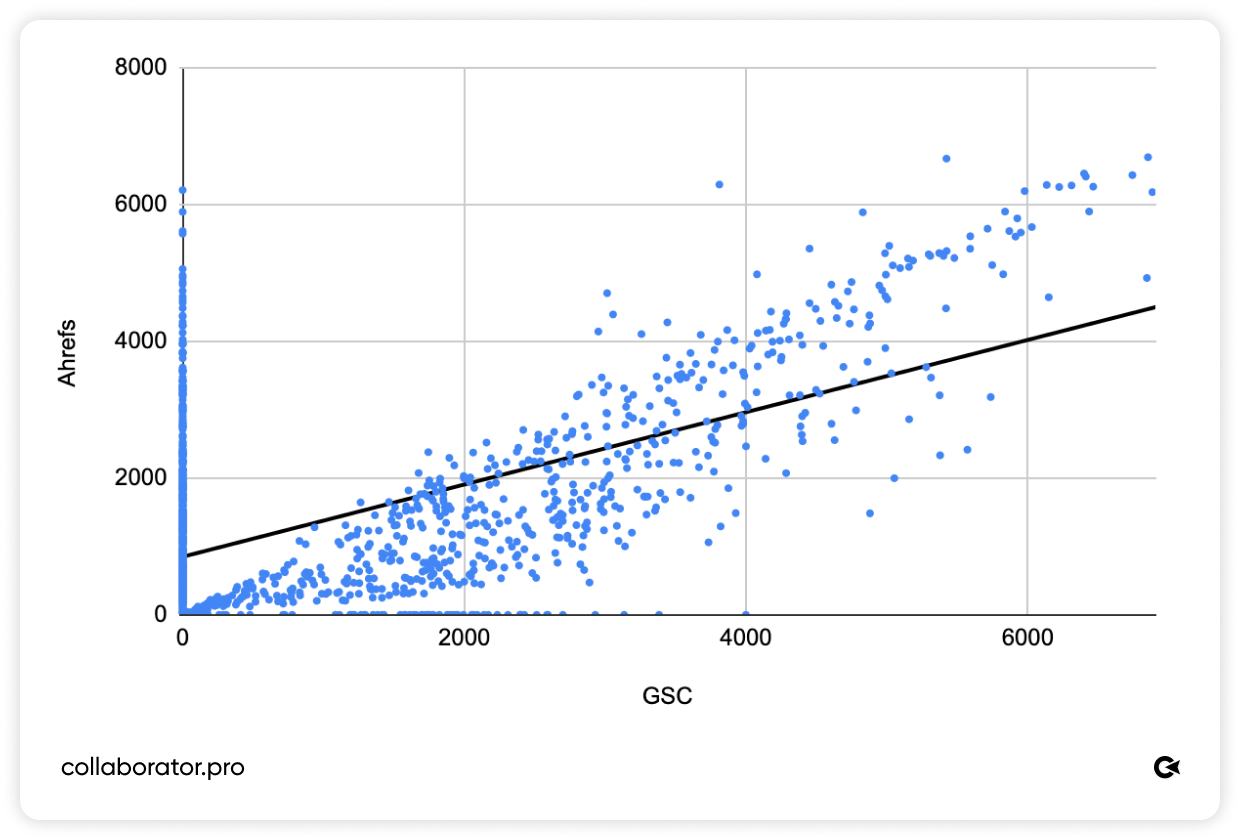
The distribution of traffic values from Ahrefs and GSC for American websites.
For European and U.S. websites, the correlation is moderate. No single source is clearly more reliable than the others. The optimal strategy is to consider multiple metrics simultaneously and assess their consistency.
- The higher the website’s traffic, the greater the discrepancy between the estimate and the actual value in GA.
- As traffic increases, more noise appears in Ahrefs data, although it still shows a reasonable correlation with GSC.
- Some websites have zero traffic in GA but non-zero values in Ahrefs, and vice versa. If you rely on a single metric, you may either overlook a good site or overestimate a poor one.
Conclusion
The correlation analysis of 7,500+ websites confirms what many SEO specialists have intuitively suspected: different tools measure traffic differently, and none of them provides a complete picture.
Here are four practical takeaways to apply in your work:
- Ahrefs traffic should not be used as the only criterion, but it is a useful indicator of SEO visibility, especially when combined with GSC.
- GSC data is the most relevant for evaluating donor value when it comes to organic search.
- GA should not be treated as a “gold standard” for SEO analysis, as part of organic traffic may be attributed to other channels, attribution can be distorted, and the data may differ from actual search activity.
- The most reliable approach is to combine multiple data sources rather than rely on a single metric, especially for high-traffic websites or projects in non-standard regions.
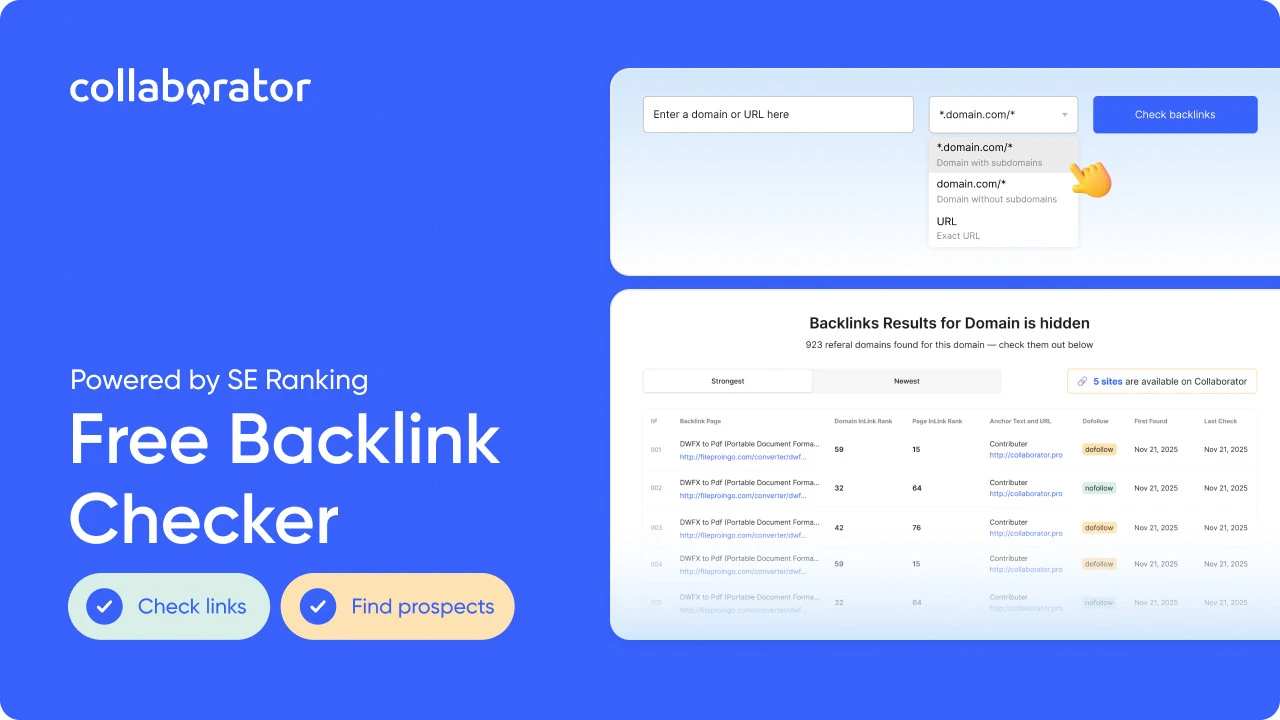
In the Collaborator catalog, many websites include data from multiple sources, including GA, GSC, and Ahrefs. It allows you to see the full picture and make informed decisions when choosing a donor, rather than blindly relying on a single metric.
Related reading
- • Accuracy of Ahrefs, Semrush, and Similarweb: Which SEO Tool Is Best for Traffic Analysis?
- • +1469% Traffic in 2 Years: E-Commerce SEO Case Study by WEDEX
- • 25 Press Release Submission Sites List 2026: Best Websites to Submit Press Releases [Free & Paid]
- • Free Backlinks: 55 High-Authority Sites List to Build Links for Free in 2026
- • 175+ Free Guest Posting Sites List 2026. Top Websites To Submit Guest Posts
- • How to Integrate Collaborator API to Automate SEO and Link Building Workflows
- • Collaborator Introduces a Free Backlink Checker: What It Shows & How to Use